
Calling all Eggheads
- Thread starter HeadHodge
- Start date

Palmetto
Thank God!
The reason why HPLC gives nices spectral data is because it separates out different constituents from a sample. A pure substance doesn't always give beautiful peaks. Mixtures generally don't give clean visible spectral peaks, unless the constituents are chemically highly different, but even then absorbance is dominated by ring structures moreso than most chemical structures..
verticity
I'm interested in things
Exactly. It ain't gonna be pretty, but you might be able to tease something out of the mess... You don't need actual isolated peaks in the UV spectrum, but you do need distinct structure (i.e. shapes, blobs, shoulders, nads, what have you) that you can fit to.The reason why HPLC gives nices spectral data is because it separates out different constituents from a sample. A pure substance doesn't always give beautiful peaks. Mixtures generally don't give clean visible spectral peaks, unless the constituents are chemically highly different, but even then absorbance is dominated by ring structures moreso than most chemical structures..
verticity
I'm interested in things
My brain is fried.Verticity blew chunks.... Huhh, huhh, huhh
HeadHodge
Bula To Eternity
@verticity thanks for all the good stuff. The math doesn't look that hard, but I'm still fuzzy about the actual testing techniques needed to get good valid results to analyse.
So a few thoughts/questions
* Each lactone is made up of several molecules bonded together. Does the spectro graph peak at each molecule or only once at a place that represents the actual lactone?
* Once you find the wavelength of a lactone, would you expect it that lactone to show up at the same wavelength for every type of kava tested?
* If you prepare and test the exact same kava multiple times, you would expect the spectro graph to be the same in all cases, but would the amplitudes be the same? It seems maybe not because it would be hard to duplicate the 'exact' same extraction for each test. If the amplitudes are different is there an easy way to 'calibrate' or 'normalize' the test results so they all align correctly if the graphs were to be overlaid on top of each other? Hopefully you get my meaning because I know I'm not explaining it very well.
* If you look at the results from the the two papers, the lactones are at certain wavelengths on the spectrum in a certain order. Would you expect that order to be the same with the absorbance test results?
avahZ
YAHWEH Shalom


Rick.Sanchez
Kava Enthusiast
I'm going to say this isn't a good idea. Ill throw out my thoughts on trying to use this method
-Your signal:noise is going to be awful without purifying your samples to some extent, and if you purify your samples, you would also need to control for kavalactones lost in your solvent extractions. There is a reason why people typically use absorption as a spectroscopic method for samples that are already relatively pure, and rarely for mixtures (as palmetto also mentioned).
-A decent uv vis will be spendy
-This is a serious undertaking. If you figure it out, you could almost certainly publish your results in a journal somewhere. If you worked in a lab and had access to a research budget and equipment, i would say go for it, but if this is a home project for someone that doesnt have a chemistry background, it could very easily become a huge undertaking.
I really dont think absorbance is the way to go. In fact, i think most traditional spectroscopic methods are going to be a poor choice for a quick and dirty approach. I really dont want to discourage anyone because i think it's a great idea, and there's definitely a cheap, easy way to determine kavalactone content. Someone just needs ro figure it out.
All that said, i still need to read the papers, so maybe theres some key information that I'm missing. I'm a biochemist, so I have plenty of experience using absorbance to quantitate biomolecule concentrations, but i dont have a lot of experience with spectroscopy in general. I'm not very knowledgeable in that realm, so I might be missing something there . But from what I do know, i would discourage you from spending the money and time to try this approach.
HeadHodge
Bula To Eternity
Thanks for the great feedback. Hopefully you will read the papers (they are pretty short) and then toss some ideas out there for us to consider.(including reflective testing)I'm going to say this isn't a good idea. Ill throw out my thoughts on trying to use this method
-Your signal:noise is going to be awful without purifying your samples to some extent, and if you purify your samples, you would also need to control for kavalactones lost in your solvent extractions. There is a reason why people typically use absorption as a spectroscopic method for samples that are already relatively pure, and rarely for mixtures (as palmetto also mentioned).
-A decent uv vis will be spendy
-This is a serious undertaking. If you figure it out, you could almost certainly publish your results in a journal somewhere. If you worked in a lab and had access to a research budget and equipment, i would say go for it, but if this is a home project for someone that doesnt have a chemistry background, it could very easily become a huge undertaking.
I really dont think absorbance is the way to go. In fact, i think most traditional spectroscopic methods are going to be a poor choice for a quick and dirty approach. I really dont want to discourage anyone because i think it's a great idea, and there's definitely a cheap, easy way to determine kavalactone content. Someone just needs ro figure it out.
All that said, i still need to read the papers, so maybe theres some key information that I'm missing. I'm a biochemist, so I have plenty of experience using absorbance to quantitate biomolecule concentrations, but i dont have a lot of experience with spectroscopy in general. I'm not very knowledgeable in that realm, so I might be missing something there . But from what I do know, i would discourage you from spending the money and time to try this approach.
Or, maybe I'll get a GoPro drone instead to play with for Christmas
")
Last edited:
verticity
I'm interested in things
What you say is accurate. This would involve original research, and would is the kind of thing you could write an actual scientific paper about, if it worked, which it might not.I'm going to say this isn't a good idea. Ill throw out my thoughts on trying to use this method
-Your signal:noise is going to be awful without purifying your samples to some extent, and if you purify your samples, you would also need to control for kavalactones lost in your solvent extractions. There is a reason why people typically use absorption as a spectroscopic method for samples that are already relatively pure, and rarely for mixtures (as palmetto also mentioned).
-A decent uv vis will be spendy
-This is a serious undertaking. If you figure it out, you could almost certainly publish your results in a journal somewhere. If you worked in a lab and had access to a research budget and equipment, i would say go for it, but if this is a home project for someone that doesnt have a chemistry background, it could very easily become a huge undertaking.
I really dont think absorbance is the way to go. In fact, i think most traditional spectroscopic methods are going to be a poor choice for a quick and dirty approach. I really dont want to discourage anyone because i think it's a great idea, and there's definitely a cheap, easy way to determine kavalactone content. Someone just needs ro figure it out.
All that said, i still need to read the papers, so maybe theres some key information that I'm missing. I'm a biochemist, so I have plenty of experience using absorbance to quantitate biomolecule concentrations, but i dont have a lot of experience with spectroscopy in general. I'm not very knowledgeable in that realm, so I might be missing something there . But from what I do know, i would discourage you from spending the money and time to try this approach.
In the attached papers, they use reflectance NIR spectroscopy of unpurified dry samples to get OK estimates of kavalactone profiles, but not as good as HPLC. If you look at the published spectra of the KLs and FKs, there is enough distinct structure that I think a model could be made to back out the KL and FK numbers from. It might be very rough, but I think it is safe to say the technique could definitely distinguish noble from tudei kava, at the very least, and maybe give some more hints about the details of the KLs and FKs. Of course, it will never be as accurate as HPLC.
verticity
I'm interested in things
Each kavalactone is a single molecule made up of atoms bonded together. The molecule moves around, vibrates, rotates, does the cha-cha and the "robot". It absorbs light at particular wavelength, that cause it to execute these dance moves. When it absorbs UV light, it does the cha-cha. When it absorbs visible light, it does the "robot". When it absorbs infrared radiation it vibrates, and when it absorbs microwaves, it rotates. It's a dancing fool all over the electromagnetic spectrum. It responds to many wavelengths and does all kind of crazy shit in response. When the kavain molecule absorbs light with a wavelength of 399.72 nm, for example, it executes Michael Jackson's moonwalk move.* Each lactone is made up of several molecules bonded together. Does the spectro graph peak at each molecule or only once at a place that represents the actual lactone?
Now when you put this dancing molecule in a solvent, it has the same effect as a person trying to dance underwater. All the dance moves are spread out all over the spectrum.
So, basically, no the spectrum does not have a single peak for each molecule. The spectrum of any particular kavalactone is in general a complicated squiggle.
The spectrum of a lactone will be the same regardless of what type of kava it finds itself in.* Once you find the wavelength of a lactone, would you expect it that lactone to show up at the same wavelength for every type of kava tested?
The spectra of multiple runs will be pretty similar, but not identical, because there is always instrumental and sampling error, like you point out. For this reason, it is common practice to do multiple runs, average them together, and use simple statistics (you calculate the standard deviations, basically) so that you end up with a spectrum with "error bars". You then need to take these error bars into account in all your subsequent calculations.* If you prepare and test the exact same kava multiple times, you would expect the spectro graph to be the same in all cases, but would the amplitudes be the same? It seems maybe not because it would be hard to duplicate the 'exact' same extraction for each test. If the amplitudes are different is there an easy way to 'calibrate' or 'normalize' the test results so they all align correctly if the graphs were to be overlaid on top of each other? Hopefully you get my meaning because I know I'm not explaining it very well.
No, I don't think the IR wavelengths in the papers would have any thing to do with the UV spectra.* If you look at the results from the the two papers, the lactones are at certain wavelengths on the spectrum in a certain order. Would you expect that order to be the same with the absorbance test results?
HeadHodge
Bula To Eternity
That was a totally awesome reply. I would give you 10 likes for it if I could....
So, basically, no the spectrum does not have a single peak for each molecule. The spectrum of any particular kavalactone is in general a complicated squiggle.
I was afraid your answer was going to be that. I was hoping that a lactone would have a narrow spectrum like a regular data modem does by using a single frequency. Instead it appears that it acts more like a spectrum modem which uses a multitude of frequencies over a wide spectrum.
If that's the case I can more appreciate the difficulty of doing this and can also see the benefit in using pure lactone samples to identify the 'signature' of the lactone. Sigh...
Don't know why I was expecting a single narrow spectrum peak per lactone other than looking at HPLC graphs. Which I don't really understand anyways.
If I obtained a sample of one of the lactones to measure and map a spectrum signature with it. What do you think my odds of success would be to use that signature to identify the amount of that lactone in an extracted sample of a powdered kava?
Rick.Sanchez
Kava Enthusiast
I read the papers. In my opinion, your best bet would be to try repeating the Lasme experiment.
I'm still thinking this isnt a good idea. Gautz et al had a difficult time getting anything useful from the NIRS approach. i think that's pretty telling. This will probabaly only be worthwhile in industry.
I'm still thinking this isnt a good idea. Gautz et al had a difficult time getting anything useful from the NIRS approach. i think that's pretty telling. This will probabaly only be worthwhile in industry.
Rick.Sanchez
Kava Enthusiast
The absorbance spectrum for each lactone will vary as a function of wavelength, but you would probably only care about the wavelength corresponding to it's absorbance maximum. Part of what makes this not feasible is the structural similarities of all the kavalactones. youre going to need expensive equipment to get a discernible result.That was a totally awesome reply. I would give you 10 likes for it if I could.
I was afraid your answer was going to be that. I was hoping that a lactone would have a narrow spectrum like a regular data modem does by using a single frequency. Instead it appears that it acts more like a spectrum modem which uses a multitude of frequencies over a wide spectrum.
If that's the case I can more appreciate the difficulty of doing this and can also see the benefit in using pure lactone samples to identify the 'signature' of the lactone. Sigh...
Don't know why I was expecting a single narrow spectrum peak per lactone other than looking at HPLC graphs. Which I don't really understand anyways.
If I obtained a sample of one of the lactones to measure and map a spectrum signature with it. What do you think my odds of success would be to use that signature to identify the amount of that lactone in an extracted sample of a powdered kava?
HeadHodge
Bula To Eternity
Thanks for taking the time. Guess it would be nice if there was chemical that could be added that would isolate or filter the lactone to something distinguishable and measurable. Sigh..I read the papers. In my opinion, your best bet would be to try repeating the Lasme experiment.
I'm still thinking this isnt a good idea. Gautz et al had a difficult time getting anything useful from the NIRS approach. i think that's pretty telling. This will probabaly only be worthwhile in industry.
verticity
I'm interested in things
As a matter of fact, since you mention that:Thanks for taking the time. Guess it would be nice if there was chemical that could be added that would isolate or filter the lactone to something distinguishable and measurable. Sigh..
Ascorbic acid reacts chemically with kavain to change it into DHK, by reducing the central double bond of kavain. It would also change M to DHM. (It would not change Y to DMY, but it would change it to something that is not one of the big 6) So if you react with a lot of ascorbic acid so that these reactions go as far to completion as they can, you would then have an extract with only 3 KLs in it (roughly speaking, remembering there are more than 6 KLs). If you take the UV spectrum of the original extract with all 6 KLs, and then take the spectrum of the ascorbic acid extract, maybe you could easily get the ratio of K + M + Y to DHK + DHM which would not be a bad proxy for "nobleness". (of course another thing to consider is what effect ascorbic acid would have on the FKs, which I don't know)
Also, I have talked here somewhere about an idea for how to separate out the flavakavains out. This could be done with a simple liquid-liquid solvent extraction, because FKs are much less polar than KLs. So you could extract the FKs, basically with some solvents and shaking in a piece of glassware, and measure their spectra separately. Then you could get FK/KL ratio.
I'm sure there are other simple separation techniques that could be used to isolate certain parts of the samples.
verticity
I'm interested in things
...
If I obtained a sample of one of the lactones to measure and map a spectrum signature with it. What do you think my odds of success would be to use that signature to identify the amount of that lactone in an extracted sample of a powdered kava?

verticity
I'm interested in things
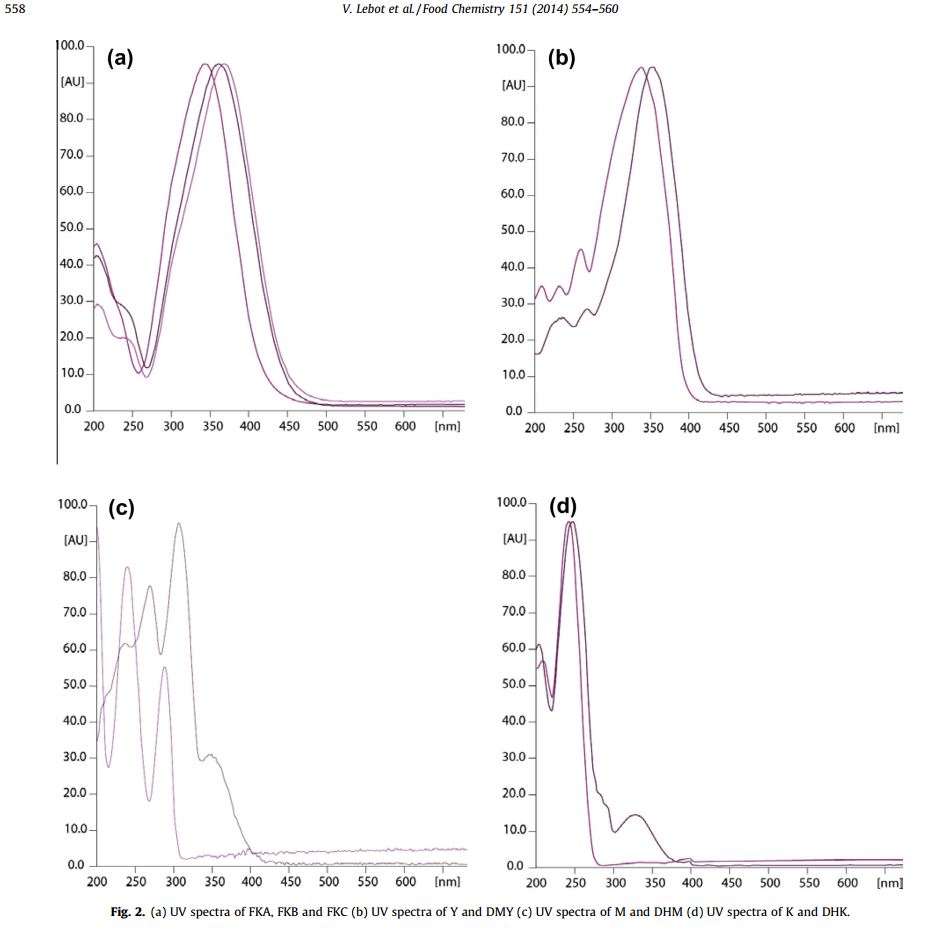
@Rick.Sanchez Here are what the published UV spectra of the isolated flavokavains and kavalactones look like. I think the kavalactones are distinct enough that they could be distinguished.
verticity
I'm interested in things
@HeadHodge, the reason the HPLC graphs have narrow peaks for each KL is that the way it works is by physically separating them in time as they travel through a tube, and then detects the signal at a single wavelength (or actually the integrated signal using a UV lamp with a particular central wavelength). So what you see in an HPLC chart is actually all the kavalactones marching single file, their guts sucked in and backs ramrod straight, each one smartly saluting as it passes by (to use a military analogy)